
The average Rugby home lost £10,026 in a year and is back to its January 2023 value. Rugby is the only Warwickshire district falling, and flats fell hardest.
The average home in Rugby borough was worth £272,696 in July 2026. A year earlier it was worth £282,722.
That is a fall of £10,026, or 3.5%. It is the steepest annual fall recorded in the borough since May 2011, and it puts the average Rugby home back almost exactly where it stood in January 2023.
The figures come from the UK House Price Index, which HM Land Registry publishes monthly from completed sales. July is the most recent month available.
Three and a half years, and nothing to show for it
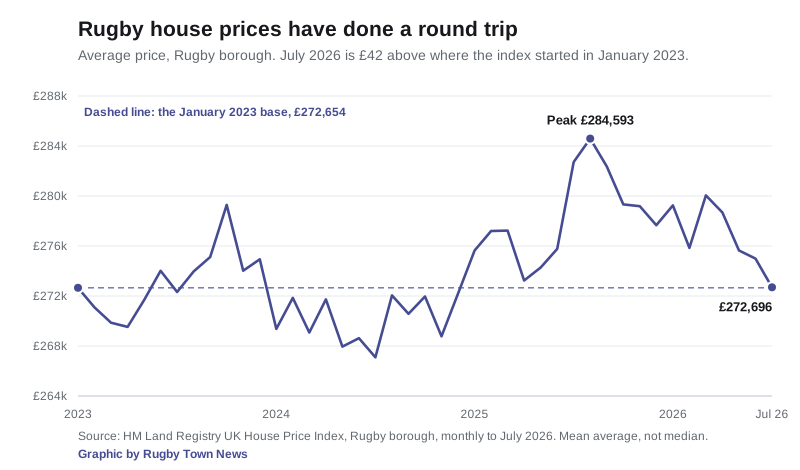
The index number for Rugby in July 2026 is 100.0. That is not a coincidence or a rounding. January 2023 is the base month of the UK House Price Index, the month the series sets to 100, and Rugby has returned to it.
In January 2023 the average Rugby home was worth £272,654. In July 2026 it was worth £272,696. The difference is £42, across three and a half years.
Two other markers are worth having:
- July’s figure is the lowest since December 2024, when the average was £272,186
- it is £11,897 below the borough’s peak of £284,593, set in August 2025
The only Warwickshire district going backwards
Rugby is not following the county. It is the only one of Warwickshire’s five districts where the average price fell over the year, and by some distance the weakest.
| District | Average, July 2026 | 12-month change |
|---|---|---|
| Stratford-on-Avon | £396,753 | +1.6% |
| Warwick | £369,220 | +1.7% |
| North Warwickshire | £273,776 | +5.9% |
| Rugby | £272,696 | -3.5% |
| Nuneaton and Bedworth | £228,142 | +1.6% |
| Warwickshire | £307,489 | +1.0% |
| England | £293,479 | +1.1% |
Rugby now sits £34,793 below the county average and £20,783 below the England average. A commuter town on the West Coast Main Line, 52 minutes from Euston on the fastest train, is now cheaper than the England average by more than twenty thousand pounds.
North Warwickshire has overtaken Rugby
This is the part a Rugby seller will feel. For years Rugby was the third dearest district in Warwickshire. In July 2026 it dropped to fourth.
North Warwickshire’s average is £273,776, which is £1,080 above Rugby. Checking the full published series back to 2005, the last month North Warwickshire was dearer than Rugby was January 2021. That is a gap of 66 months.
A year ago the two were £24,110 apart, in Rugby’s favour. North Warwickshire rose 5.9% over the same twelve months in which Rugby fell 3.5%.
Flats have given up nearly five years
Every property type in the borough fell over the year, but not evenly.
| Type | July 2026 | Change in 12 months |
|---|---|---|
| Detached | £447,358 | -£17,910 (-3.8%) |
| Semi-detached | £274,072 | -£8,114 (-2.9%) |
| Terraced | £214,547 | -£6,657 (-3.0%) |
| Flat or maisonette | £126,018 | -£8,339 (-6.2%) |
Flats are the outlier. At £126,018 the average Rugby flat is now worth less than at any point since November 2021, and £9,469 below the December 2022 peak of £135,487. In cash terms a flat lost less than a detached house did. As a share of its value it lost far more.
The round trip is not the same for everyone. The borough index sits at exactly 100.0, its January 2023 base, but the index for each type does not. Flats are at 94.5, five and a half per cent below where they started. Terraced houses are at 101.0 and semis at 101.1, slightly above. Detached sits at 99.7. The average is back where it was; the mix underneath it has moved.
The first-time buyer average tells a similar story. It stands at £229,855, down £7,864 on the year, and is also the lowest since December 2024. A former owner-occupier, someone selling one home to buy another, paid an average of £323,179, down 3.7%.
Read the number carefully
Three things matter with this series, and local coverage routinely skips them.
- This is a mean, not a median. A handful of large sales pull the average up in a way a typical buyer never sees. The mean is what the index publishes, so it is the figure we quote, but it is not the price of a typical Rugby house.
- The annual fall is measured against a high month. July 2025 was itself a 2.5% jump on June 2025, and it came one month before the borough’s all-time peak. Comparing with a spike exaggerates the drop. The comparison with January 2023, three and a half years back, is the more honest one, and it is flat.
- The index runs on completions, and recent months get revised. July’s figure reflects sales agreed several months earlier. And revisions are not always small: see below.
Correction: June was revised down
On 23 August we reported that the average Rugby home was worth £276,208 in June 2026, up £440 or 0.2% over twelve months, in our June write-up.
HM Land Registry has since revised that month. June now stands at £274,989, which is £1,219 lower, and the annual change has been revised from +0.2% to -0.3%. The revision reverses the direction: what we published as a small rise was, on the corrected figures, a small fall.
We have added a dated correction note to the June article. The underlying point in it, that Rugby was the weakest district in Warwickshire, was right and has since got more pronounced.
What it means for you
- If you are selling, the borough average is back to its January 2023 level. If you bought at the August 2025 peak, the index puts the average home about £11,900 below what you paid. If you bought before 2023, you are still ahead.
- If you are buying, Rugby has become cheaper relative to everywhere around it. It is £96,524 below Warwick and £20,783 below the England average, and it is now the only district in the county where the index is falling.
- If you own a flat, yours is the type carrying most of the fall: down 6.2% over the year and back to 2021 values.
- If you are appealing a council tax band, none of this helps. Bands are set on 1 April 1991 values and current prices are not grounds for a challenge. Our council tax bands page sets out what is.
Our Rugby house prices page carries the fuller picture, including median sold prices for all fifteen borough wards. August’s claimant count, which reached its highest level since October 2021, is worth reading alongside it, as is the borough’s planning caseload.
Have your say