
The average Rugby home was worth £276,595 in September, down £5,535 in a year, the biggest fall in Warwickshire. Flats fell 4.2%, more than any other type.
The average home in Rugby borough was worth £276,595 in September 2026, down £5,535 on a year earlier.
That is a fall of 2.0%, the biggest annual fall of any district in Warwickshire. Across England, prices rose 0.8% over the same year.
The figures are from the UK House Price Index for September 2026, which HM Land Registry published on Wednesday 18 November. The index is built from completed sales, so September is the latest month it covers. Rugby’s own figures are on the Land Registry data site.
Every type of home is worth less
Prices fell for all four kinds of property in the borough. Flats fell furthest.
| Type of home | September 2025 | September 2026 | Change |
|---|---|---|---|
| Detached | £463,466 | £453,369 | down £10,097 (2.2%) |
| Semi-detached | £281,903 | £278,133 | down £3,770 (1.3%) |
| Terraced | £221,251 | £217,701 | down £3,550 (1.6%) |
| Flat or maisonette | £133,596 | £127,925 | down £5,671 (4.2%) |
| All homes | £282,130 | £276,595 | down £5,535 (2.0%) |
The average price paid by first-time buyers fell by £4,040, or 1.7%, to £233,247.
Prices also dipped over the month. The August average was £279,621, so September came in £3,026 lower.
Only two Warwickshire districts are falling
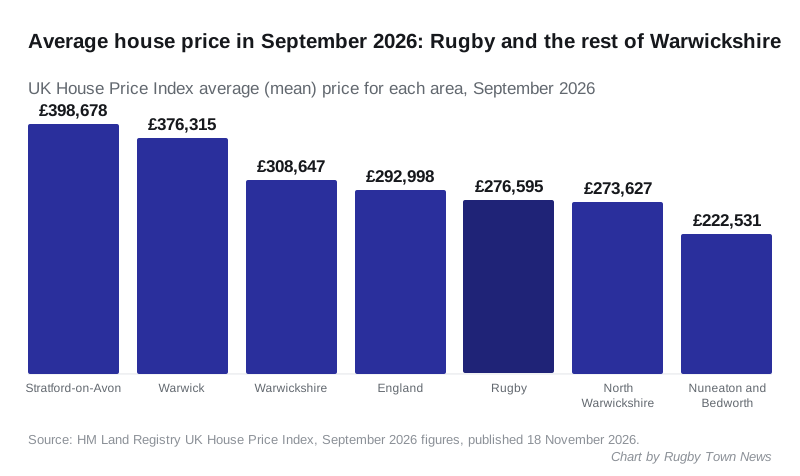
Rugby and Nuneaton and Bedworth were the only districts in the county where the average price fell in the year to September. Rugby’s fall was the larger of the two.
| Area | Average price, September 2026 | Change in a year |
|---|---|---|
| Stratford-on-Avon | £398,678 | up 3.2% |
| Warwick | £376,315 | up 2.6% |
| North Warwickshire | £273,627 | up 4.2% |
| Rugby | £276,595 | down 2.0% |
| Nuneaton and Bedworth | £222,531 | down 1.5% |
| Warwickshire | £308,647 | up 1.1% |
| West Midlands | £250,355 | up 0.9% |
| England | £292,998 | up 0.8% |
Rugby homes are still worth more on average than those in North Warwickshire, but only by £2,968. North Warwickshire had the fastest rise in the county over the year.
Four years with little to show
A year ago the picture was very different. In September 2025, Rugby’s average price was rising at 4.3% a year, according to the index.
Measured over a longer stretch, prices have barely moved:
- September 2022: £274,082
- September 2023: £275,121
- September 2024: £270,579
- September 2025: £282,130
- September 2026: £276,595
So the average Rugby home is worth £2,513 more than it was four years ago, a rise of under 1%.
Read the number carefully
UKHPI is a mean average, adjusted for the mix of homes sold. It is not the median, and it is not what any single house sold for. A handful of very expensive sales can pull a mean up, and a quiet month can move it sharply in a borough the size of Rugby.
The latest months are also revised as more sales are registered. When we reported July’s figures in September, the index showed a 3.5% annual fall. July now shows a 3.2% fall. September’s figures will be revised in the same way.
What it means for you
- If you are buying, Rugby is one of the few places in Warwickshire where prices are lower than a year ago, and flats have fallen most.
- If you are selling, expect buyers to know this. A semi-detached house is worth about £3,800 less on average than a year ago, and a detached house about £10,100 less.
- If you want the figures for your own street, the median sold prices by ward and village come from actual recorded sales.
Have your say