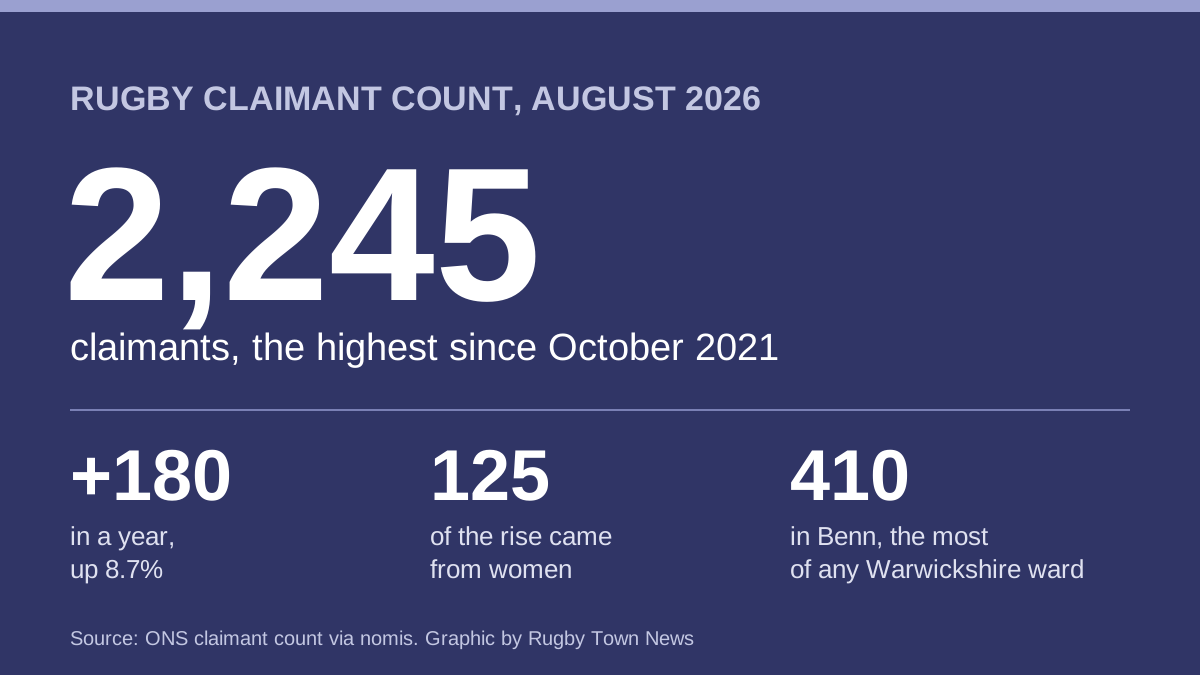

Rugby's claimant count reached 2,245 in August, the highest since October 2021. Women account for 125 of the 180 extra claimants over the year.
Rugby borough had 2,245 people claiming out-of-work benefits in August 2026. That is the highest monthly figure since October 2021, when the count was still coming down from its pandemic peak.
The figure is 180 higher than a year earlier, a rise of 8.7%. Most of that rise is among women.
The numbers come from the claimant count for August 2026, which the Office for National Statistics published through nomis on Tuesday 15 September. The local authority figures are labelled official statistics in development.
The borough number
- 2,245 claimants in August 2026, up from 2,180 in July
- 2.9% of residents aged 16 to 64, unchanged on the month
- 3.0% for Warwickshire as a whole, and 3.9% for the United Kingdom
- 2,065 a year earlier, in August 2025
Rugby’s rate is still below the county’s and well below the UK’s. The direction is the concern. The count bottomed out at 1,955 in December 2025 and has risen in most months since.
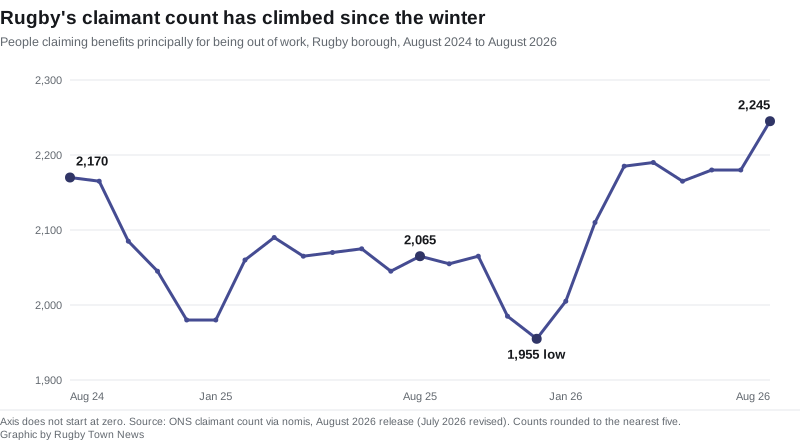
A correction to last month’s figure. When the July count was first published, it showed 2,220 claimants in Rugby. The ONS has since revised July to 2,180. So the rise from July to August is 65, not 25, and our July report now carries a note saying so.
Women drove the rise
Over the year to August, the number of men claiming in Rugby rose by 55, from 1,140 to 1,195. The number of women rose by 125, from 925 to 1,050.
That is a 13.5% rise among women. It is almost double Warwickshire’s figure and far above the national one:
| Women claiming | August 2025 | August 2026 | Change |
|---|---|---|---|
| Rugby | 925 | 1,050 | +13.5% |
| Warwickshire | 4,730 | 5,075 | +7.3% |
| United Kingdom | 739,125 | 745,615 | +0.9% |
For men the picture is reversed. Rugby’s 4.8% rise is smaller than Warwickshire’s 8.9% (5,845 to 6,365), though above the UK’s 3.1%.
The data does not say why. It counts claims; it does not record the reasons behind them.
By age, it is not the young
It would be easy to assume the rise is among young people. In Rugby it mostly is not.
| Age | Rugby, Aug 2025 | Rugby, Aug 2026 | Rugby change | Warwickshire change | UK change |
|---|---|---|---|---|---|
| 16 to 24 | 375 | 445 | +18.7% | +23.6% | +10.0% |
| 25 to 49 | 1,200 | 1,255 | +4.6% | +2.2% | -1.0% |
| 50 and over | 490 | 545 | +11.2% | +9.8% | +3.6% |
Young claimants rose faster than any other group in Rugby. But they rose faster still across Warwickshire, from 2,055 to 2,540. The borough is doing better than its county on that measure.
The groups where Rugby is doing worse are the older ones. The 25 to 49 count fell across the UK and rose in Rugby. The over-50 count rose three times as fast in Rugby as it did nationally.
Every Warwickshire district rose
Rugby was not alone this month. All five districts in the county added claimants between July and August:
| District | July 2026 | August 2026 | Rate | A year earlier |
|---|---|---|---|---|
| Nuneaton and Bedworth | 3,610 | 3,695 | 4.2% | 3,600 |
| North Warwickshire | 1,145 | 1,205 | 3.0% | 1,035 |
| Rugby | 2,180 | 2,245 | 2.9% | 2,065 |
| Warwick | 2,340 | 2,425 | 2.5% | 2,235 |
| Stratford-on-Avon | 1,790 | 1,870 | 2.2% | 1,640 |
Over the year, North Warwickshire (up 16.4%) and Stratford-on-Avon (up 14.0%) rose fastest. Rugby’s 8.7% is close to Warwick’s 8.5%. Nuneaton and Bedworth rose only 2.6%, but from a much higher rate.
Benn now clearly has the most claimants in the county
Benn ward, which covers part of the town centre around Church Street, Regent Street and Clifton Road, had 410 claimants in August. That is 5.6% of its working-age residents.
Last month we reported Benn and St Mary’s in Nuneaton as effectively tied for the largest count among Warwickshire’s 108 wards. They no longer are. St Mary’s had 385 in August, so Benn is 25 ahead. On rate, Benn is joint fourth in the county with Camp Hill in Bedworth, behind Chilvers Coton, Attleborough and St Mary’s.
The top and bottom of Rugby’s 16 wards:
| Ward | August 2026 | Rate | Change since January |
|---|---|---|---|
| Benn | 410 | 5.6% | +65 |
| Newbold and Brownsover | 235 | 3.7% | +35 |
| Eastlands | 225 | 3.5% | +25 |
| New Bilton | 220 | 3.7% | -15 |
| Admirals and Cawston | 150 | 2.4% | +30 |
| Paddox | 80 | 1.8% | +15 |
| Leam Valley | 25 | 1.8% | +5 |
Benn has added 65 claimants since January, more than any other ward. New Bilton is still the only ward with fewer claimants than in January. Admirals and Cawston added 15 in a single month, as many as Benn.
Ward counts are rounded to the nearest five, and the ward series only starts in January 2026.
What the claimant count measures
This is not the unemployment rate.
It counts people claiming benefits principally because they are out of work. That means Jobseeker’s Allowance, plus Universal Credit claimants who are required to search for work. Some of them are in low-paid part-time jobs and have to look for more hours. People who are out of work but not claiming are not counted at all.
Monthly figures also move with changes to how claims are processed, so a single month is a weak signal. The rise of 290 since December is a stronger one.
What it means for you
- If you are out of work or need more hours, Jobcentre Plus is the route to Universal Credit and work search support. Citizens Advice Rugby (BRANCAB) gives free benefits advice, and it helped 5,309 clients last year, according to the council’s voluntary sector report.
- If you are over 50 and looking for work, you are in the group where Rugby’s rise most outpaces the country’s. The same two starting points apply.
- If you follow local politics, these are the figures that sit underneath the council’s town centre plans, and the wider question of who runs Rugby is still open after the Government paused local government reorganisation.
The next claimant count, for September, is due on Tuesday 20 October 2026. For the borough’s housing market, see our Rugby house prices page.
Have your say