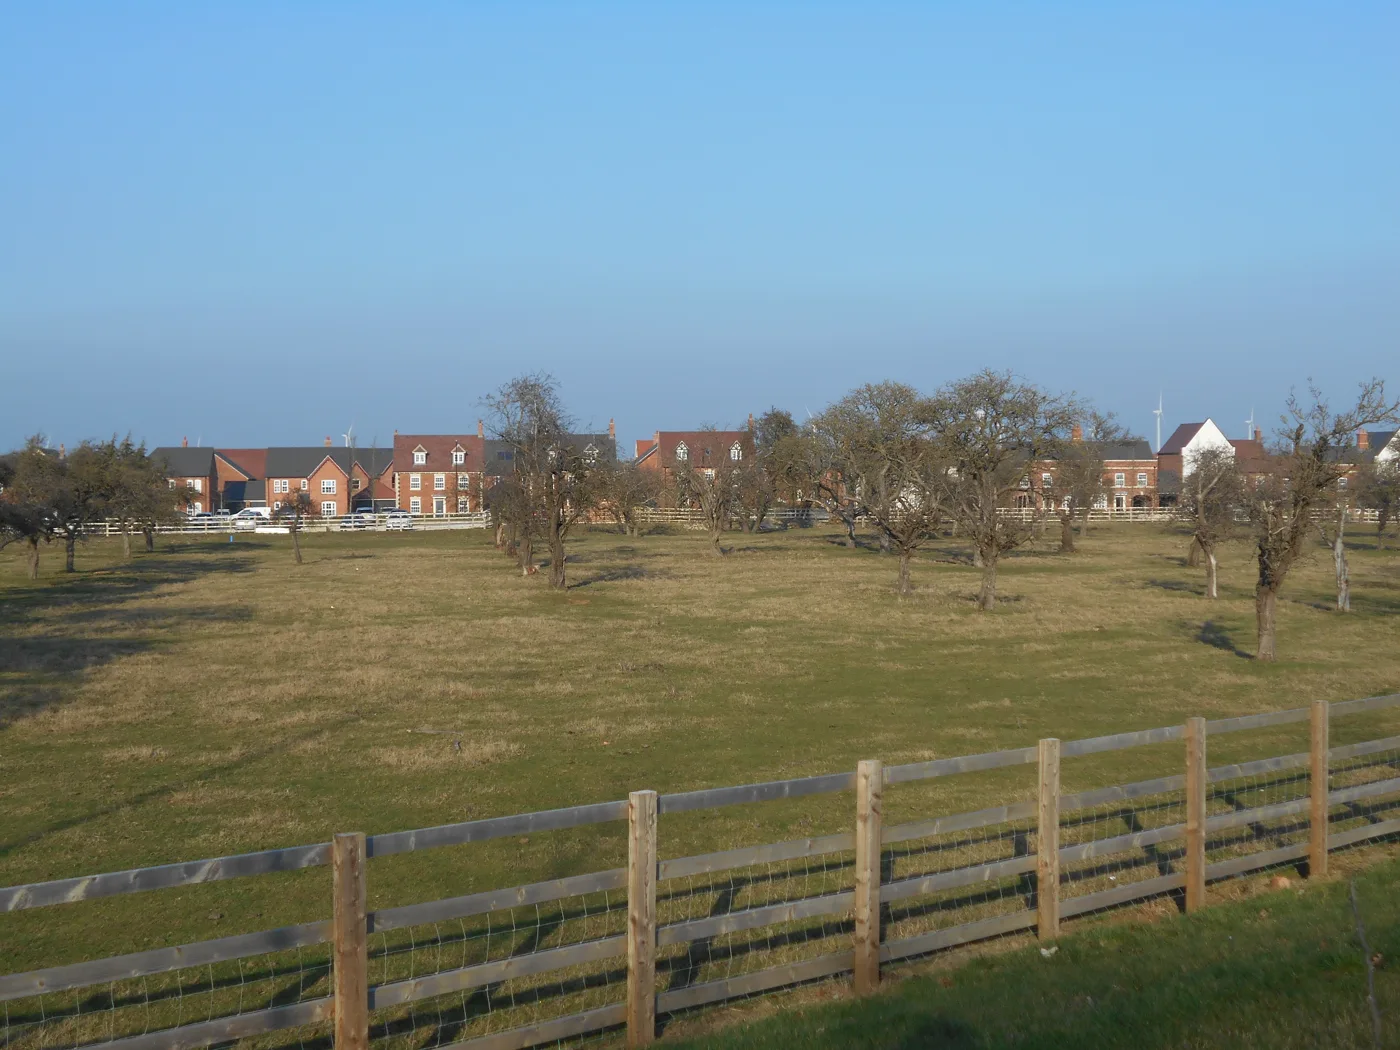

Rugby borough added 2,928 people in a year, the fastest growth of any council area in England and Wales. Most came from elsewhere in the UK, ONS figures show.
No council area in England and Wales grew faster than Rugby in the year to mid-2025. The borough’s estimated population rose from 122,666 to 125,594, an increase of 2,928 people or 2.4%.
That is according to the Office for National Statistics’ mid-2025 population estimates. The ONS bulletin names Rugby as the area with the highest annual growth, ahead of Mid Suffolk (2.1%) and Tewkesbury (2.0%). Across England and Wales as a whole, the population grew by 0.4%.
The figures were published on 29 July and returned to the headlines this month. We went back to the ONS tables to see where the extra people came from.
Where the growth came from
The ONS breaks each area’s change into births, deaths and migration. Its components of change table (MYE3) gives these figures for Rugby borough, mid-2024 to mid-2025:
| Component | In | Out | Net change |
|---|---|---|---|
| Births and deaths | 1,142 births | 1,089 deaths | +53 |
| Moves within the UK | 8,415 | 6,026 | +2,389 |
| International migration | 1,280 | 817 | +463 |
| Other adjustments | +23 | ||
| Total | +2,928 |
The story is people moving to Rugby from elsewhere in the UK. That net gain of 2,389 accounts for about 82% of the borough’s growth. International migration added 463, and births only just outnumbered deaths.
Nationally the pattern is the reverse. The ONS says most of the 0.4% growth in England and Wales came from net international migration.
How Rugby compares with its neighbours
Every other Warwickshire district grew too, but none as fast. Coventry went the other way.
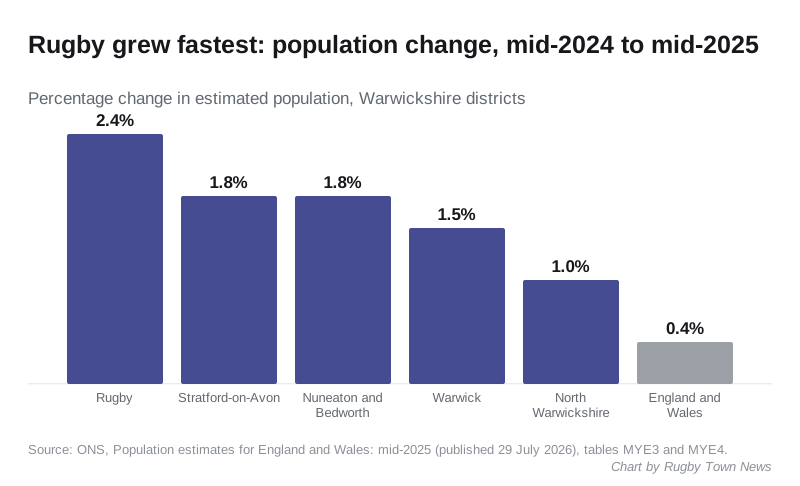
From the same ONS tables:
- Rugby: up 2,928 to 125,594 (2.4%)
- Stratford-on-Avon: up 2,576 to 148,772 (1.8%)
- Nuneaton and Bedworth: up 2,488 to 144,042 (1.8%)
- Warwick: up 2,384 to 157,925 (1.5%)
- North Warwickshire: up 643 to 67,688 (1.0%)
- Coventry: down 3,941 to 364,766 (a fall of 1.1%)
Coventry lost a net 8,372 people to moves within the UK, the largest outflow in the area. It still gained from births and from international migration, but not enough to make up the difference.
A quarter bigger since 2011
This was not a one-off. Rugby borough had 100,496 residents in mid-2011, so it has grown by 25,098 people, or 25%, in fourteen years. On our reading of the ONS table, that ranks ninth of the 318 council areas in England and Wales over the period.
The year before, growth was slightly faster still. Between mid-2023 and mid-2024 the borough grew by 2.5%, but three areas grew faster, so it ranked fourth.
The borough now has about 358 people per square kilometre, up from 286 in 2011.
A younger borough than average
Rugby’s population is younger than the national picture, according to the ONS single-year-of-age table (MYE2):
- Under 18: 27,851 people, 22.2% of residents (England and Wales: 20.3%)
- 18 to 64: 75,410 people, 60.0% (England and Wales: 60.5%)
- 65 and over: 22,333 people, 17.8% (England and Wales: 19.3%)
The homes behind it
The government counts new homes over a different year, April to March. Its net additional dwellings table (Live Table 122) records these figures for Rugby borough:
- 2022-23: 1,306 net additional homes
- 2023-24: 866
- 2024-25: 671 (provisional)
The 2024-25 figure is the lowest since 2017-18. Because the two data sets cover different twelve-month periods, they cannot be divided into one another neatly. Even so, population growth has stayed high while the number of new homes added each year has fallen.
What it means for you
A faster-growing borough puts more demand on GP surgeries, school places and roads. Several recent Rugby stories turn on exactly that:
- the business case for a new GP surgery at Houlton
- the £24m expansion of Avon Valley School, adding 300 places
- the Coton Park East design code, open for comment until 4 November
If you are buying or renting, our Rugby house prices page tracks what homes are selling for. Our planning news page follows the larger housing schemes.
How sure are these numbers?
Mid-year estimates are modelled, not counted, and the ONS publishes a range for each one. It puts Rugby’s mid-2025 population at 125,594, plus or minus 4,344. The ONS also revises earlier years when new data arrives. The ranking is the ONS’s own, from its published bulletin.
Sources: ONS, Population estimates for England and Wales: mid-2025 (bulletin, 29 July 2026); ONS, Estimates of the population for England and Wales (mid-2025 tables MYE2, MYE3, MYE4 and MYE5); MHCLG, Live Table 122: net additional dwellings by local authority district (20 November 2025).
Have your say